Types of Moving Averages play a crucial role in financial analysis, providing insights into trends and patterns within datasets. Among the popular types are Simple Moving Average (SMA), Exponential Moving Average (EMA), and Weighted Moving Average (WMA). Each of these moving averages offers unique characteristics and applications in analyzing stock prices, market trends, and other financial data. Let’s delve into the differences between these moving averages and discover when to effectively utilize them for informed decision-making.

Exploring the Essence of Moving Averages
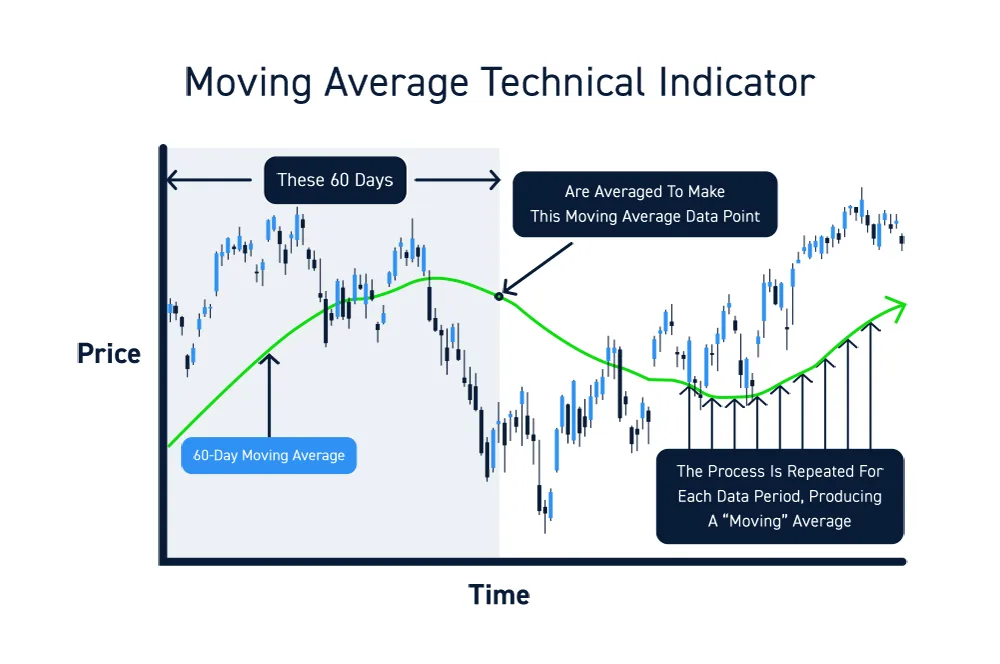
Moving averages, crucial in financial analysis, act as a smoothing mechanism by calculating the average price over a predetermined timeframe. This process aids in filtering out noise, revealing underlying trends, and potential support and resistance levels. The diverse range of moving averages, from Simple Moving Averages (SMA) to Exponential Moving Averages (EMA) and Weighted Moving Averages (WMA), offer varying methodologies to interpret financial data accurately.

Leveraging Moving Averages to Identify Trends
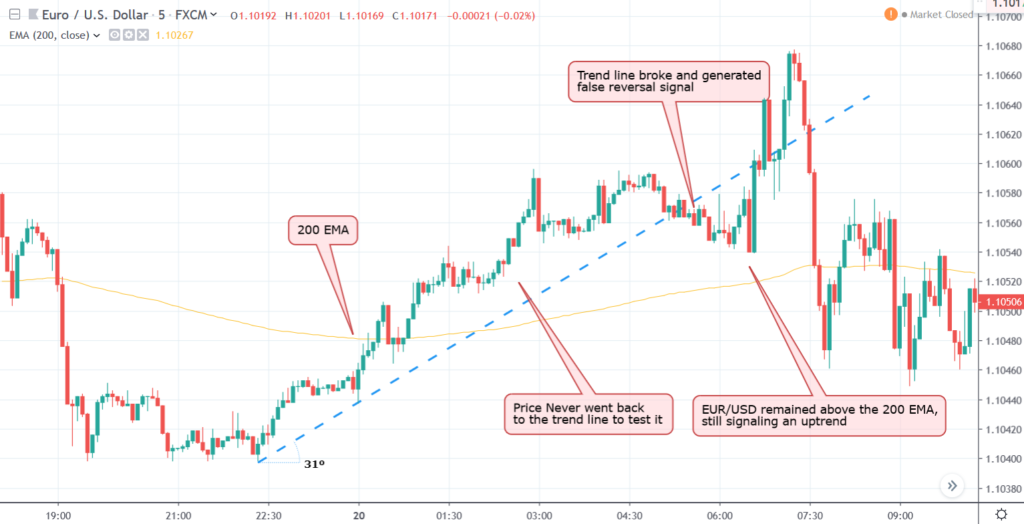
Moving averages serve as powerful tools for detecting trends in financial data. An upward-sloping moving average hints at an uptrend, showcasing a positive trajectory in asset prices. Conversely, a downward-sloping line indicates a downtrend, reflecting potential bearish movements in the market. Understanding these trends aids traders and analysts in making informed decisions based on price direction.
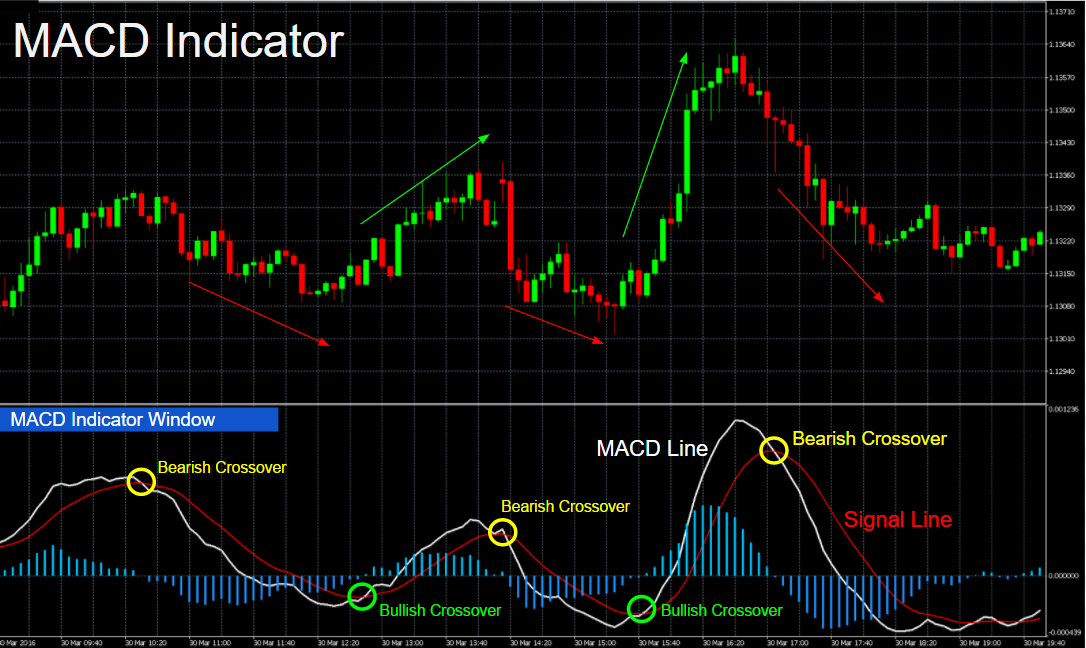
Crossovers between different moving averages are pivotal in signaling trend shifts. For instance, when a short-term moving average crosses above a long-term moving average, it often signifies a bullish trend reversal. These crossovers act as potential entry or exit points for traders, helping them capitalize on market movements and optimize their trading strategies.
Moreover, moving averages assist in identifying critical levels of support and resistance within price action. By analyzing how prices interact with moving averages, traders can pinpoint levels where assets are likely to experience buying pressure (support) or selling pressure (resistance). This insight enables traders to anticipate price movements and adjust their trading approaches accordingly, enhancing their overall strategy.

Understanding the Limitations of Moving Averages
Challenges in Utilizing Moving Averages
Moving averages, though powerful, have limitations. They often lag behind current prices, meaning they might not promptly signal short-term reversals, making them more suitable for capturing long-term trends than rapid price changes. In highly volatile or choppy markets, moving averages can give misleading signals due to delayed responsiveness.
Caution in Sole Reliance on Moving Averages
Relying solely on moving averages for trading decisions can be risky. They are best utilized in combination with other technical indicators to confirm signals, as using them in isolation may result in missing out on critical market information. Thus, traders should exercise caution and employ a holistic approach when incorporating moving averages in their analysis.

Enhancing Analysis with Combined Moving Averages and Other Indicators
Moving averages, Bollinger Bands, and MACD Integration
Integrating moving averages with indicators like Bollinger Bands and MACD offers a holistic view. Bollinger Bands provide insights into market volatility, while the MACD signals changes in momentum. Combining these indicators with moving averages can validate signals, aiding in robust decision-making.
Comprehensive Trend Analysis with Multiple Moving Averages
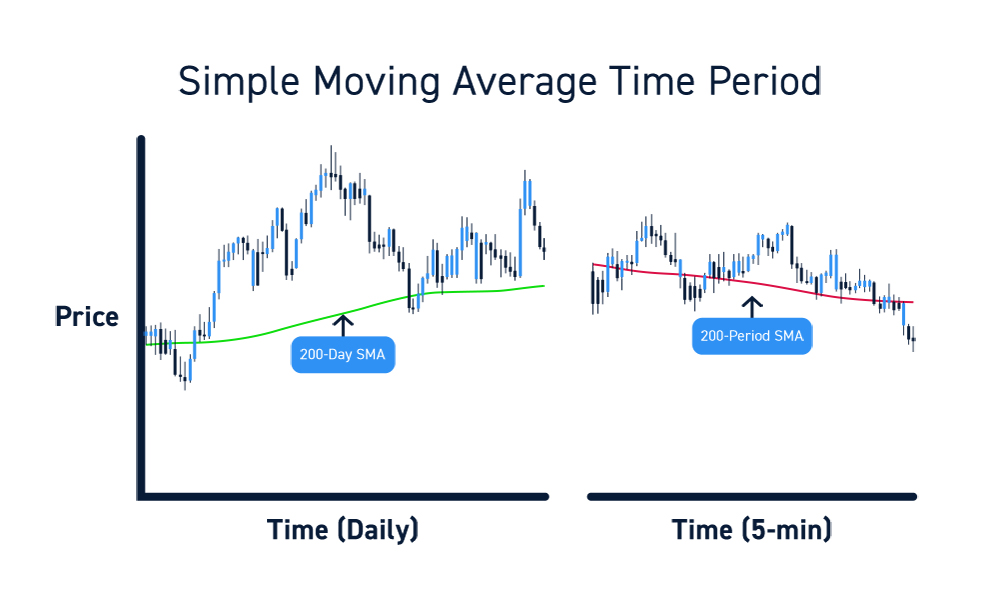
When using different moving averages with varying time frames, traders gain a more detailed perspective on price movements. Short-term moving averages respond quickly to price changes, while long-term averages provide broader trend indications. This amalgamation aids in identifying trend shifts accurately.
Confirmation of Trend Strength via Volume Integration
Leveraging volume data alongside moving averages can reinforce trend analysis. If prices move in line with increased volume, it validates the trend’s strength. This integration helps in validating signals derived from moving averages, adding a layer of confirmation to trading decisions.

Advanced Moving Average Techniques
Adaptive Moving Averages (AMA)
Adaptive Moving Averages (AMA) stand out by dynamically adjusting the weighting of prices according to market volatility. This sophisticated technique aims to enhance the responsiveness of moving averages to changing market conditions. By adapting to varying levels of price fluctuations, AMA can provide traders with more accurate trend signals, particularly in volatile markets.
Hull Moving Average (HMA)
The Hull Moving Average (HMA) is a powerful tool that minimizes lag by combining several weighted moving averages. This innovative approach significantly reduces the delay in moving average signals, making it a preferred choice for traders seeking real-time insights into market trends. HMA’s unique formula optimizes trend identification and proves particularly effective in fast-moving markets.
Ichimoku Cloud
The Ichimoku Cloud is an intricate indicator that integrates various moving averages alongside additional components like the Senkou Span and Kumo. This comprehensive approach offers traders a holistic view of price momentum, trend direction, and potential support/resistance levels. By incorporating multiple moving averages within a cloud-like chart, it provides a visually rich analysis tool for informed decision-making.
