A Comprehensive Guide to Understanding Chart Patterns for Traders is a critical resource for anyone looking to enhance their trading knowledge. This article delves into the intricate world of chart patterns, covering a wide range of patterns such as reversal, continuation, and bilateral patterns. By understanding the nuances of head and shoulders, double top/bottom, triangle, flag and pennant, rectangle, and range patterns, traders can gain valuable insights to make well-informed trading decisions. Whether you are a novice or experienced trader, mastering these chart patterns is essential for navigating the dynamic landscape of the financial markets.

Understanding Chart Patterns: A Guide for Traders
Chart patterns serve as visual representations of market psychology, revealing potential price trends. Rooted in Dow Theory, these patterns reflect the cyclical nature of market trends, aiding traders in predicting future movements. By mastering chart patterns, traders can enhance their decision-making process, refine strategies, and capitalize on market opportunities. With a myriad of patterns to explore, each holding distinct traits, traders can unlock valuable insights for successful trading endeavors.

Exploring Different Types of Chart Patterns
When delving into the world of chart patterns, traders encounter various types that offer valuable insights into market movements. Reversal patterns like the head and shoulders or double tops/bottoms signal potential trend shifts, prompting traders to reevaluate their positions carefully. Continuation patterns, such as triangles, flags, and pennants, indicate a high probability of the current trend persisting, guiding traders on potential entry and exit points. However, bilateral patterns like rectangles and ranges can be ambiguous, suggesting both reversal and continuation possibilities, requiring traders to exercise caution and confirmatory signals before making trading decisions. Understanding these diverse patterns aids traders in interpreting market dynamics effectively, enabling them to make informed and strategic trading choices. By recognizing the subtle nuances of each chart pattern, traders can enhance their ability to predict price movements and optimize their trading strategies.

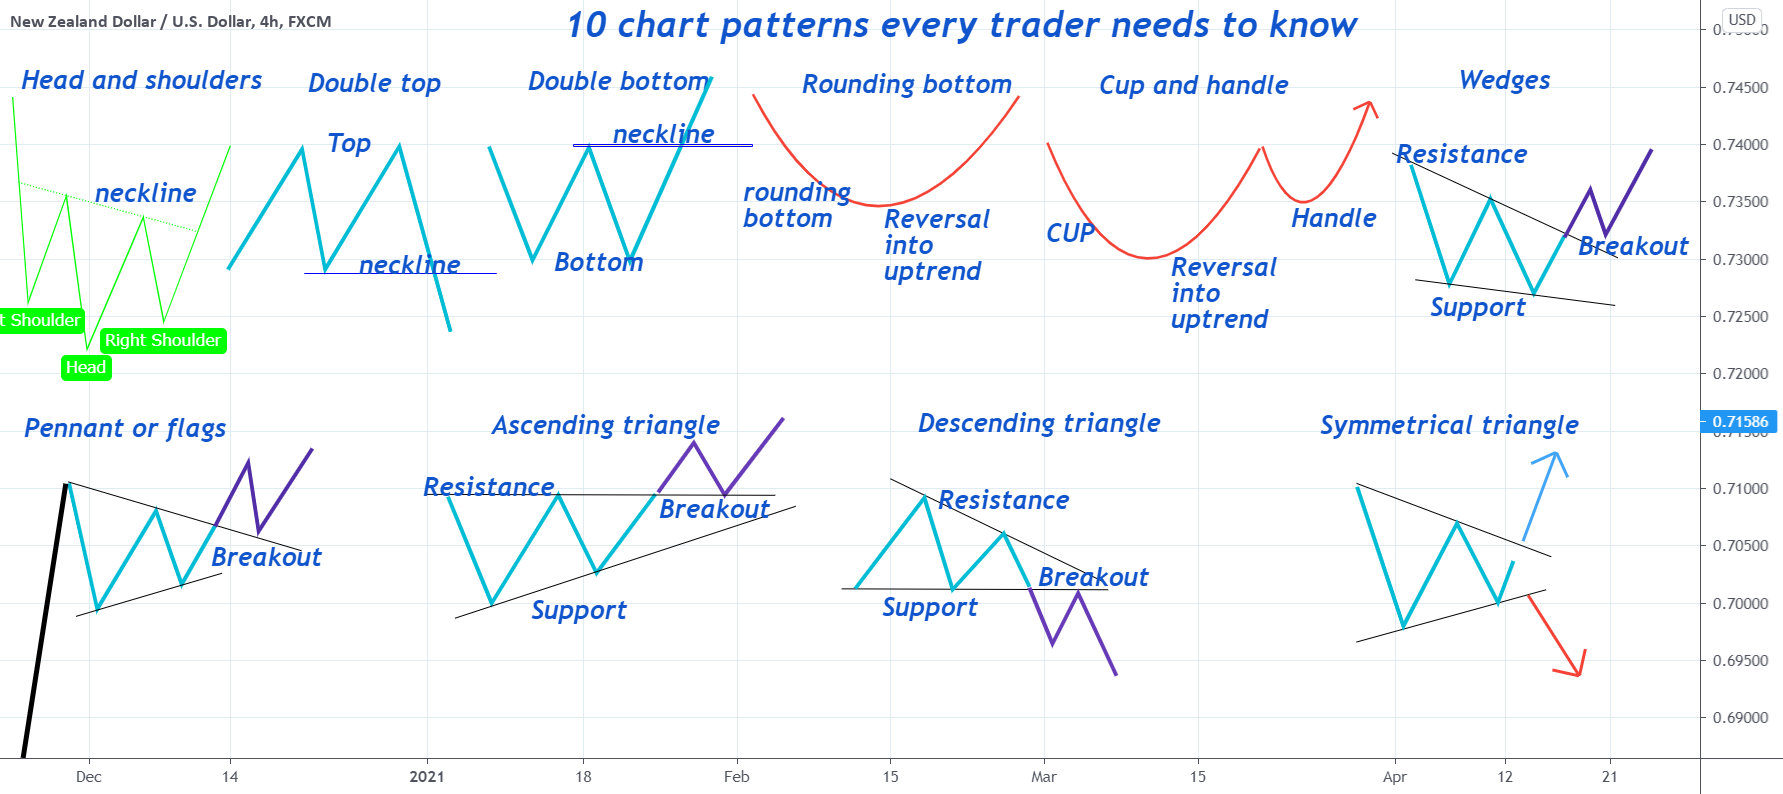
Understanding the Head and Shoulders Pattern
The Head and Shoulders pattern is a powerful reversal pattern observed in technical analysis. It consists of a central peak (the head) flanked by two smaller peaks (the shoulders). The formation is completed by drawing a neckline connecting the lows of the two shoulders, providing a visual cue for potential trend reversal. Traders look for a break below the neckline to confirm the pattern and anticipate a shift to a downtrend. This pattern signifies a shift in market sentiment from bullish to bearish, offering valuable insights for traders.

Unraveling the Double Top/Bottom Pattern
The Double Top/Bottom Pattern is a significant reversal pattern marked by twin peaks (for a double top) or troughs (for a double bottom) occurring around the same price level. A key feature is the neckline, linking the lows (in a double top) or highs (in a double bottom) of the consecutive peaks or troughs, offering a visual representation of the potential trend reversal.
When the price breaks below the neckline in a double top or above it in a double bottom, it validates the pattern as a potential reversal signal. Traders keen on Understanding Chart Patterns leverage these breakouts to anticipate changes in market direction, aiding them in making informed trading decisions based on this pattern’s implications.

Exploring Triangle Patterns in Trading
Triangle patterns, a key aspect of understanding chart patterns, are continuation patterns denoted by converging trendlines linking highs and lows. These patterns come in three main types: ascending, descending, and symmetrical. Ascending triangles show a horizontal resistance level with higher lows, while descending triangles exhibit a horizontal support level with lower highs. Symmetrical triangles display two converging trendlines. A breakout above the upper trendline in an ascending triangle or below the lower trendline in a descending triangle signifies a confirmation of the prevailing trend, offering traders valuable insights for making informed decisions.

Unraveling Flag and Pennant Patterns: Enhancing Trader Insights
Flag and Pennant Patterns, categorized as continuation patterns, signify a consolidation phase within a price range. These patterns typically follow a strong price movement and imply a potential continuation of the existing trend post-consolidation. Flags exhibit parallel trendlines, whereas pennants showcase converging trendlines, reflecting different consolidation structures. A decisive breakout above the upper trendline validates the continuation of the prevailing trend, offering traders a strategic entry point.

Exploring Rectangle and Range Patterns
Understanding Rectangle and Range Patterns
Rectangle and Range Patterns are bilateral chart patterns marked by price movements that consolidate within a specific range. Traders often observe these patterns during periods of indecision in the market, with prices oscillating between a defined upper and lower boundary.
Interpreting Breakouts in Rectangle and Range Patterns
In Rectangle and Range Patterns, a breakout above the upper boundary or below the lower boundary suggests a potential shift in the prevailing trend. Traders keen on understanding chart patterns closely monitor these breakouts as they can signal the beginning of a new trend direction.